Simulation of Bar Screens
What are the benefits of hydrograv simulations?
- Ensuring an equally distributed inflow to each bar screen
- Prevention of depositions in the up and downstream area
.
Example 1: Calibration by measurements
- Calibration of the modelling approaches including the degree of debris by measuring the water levels
- Comparison at different discharges
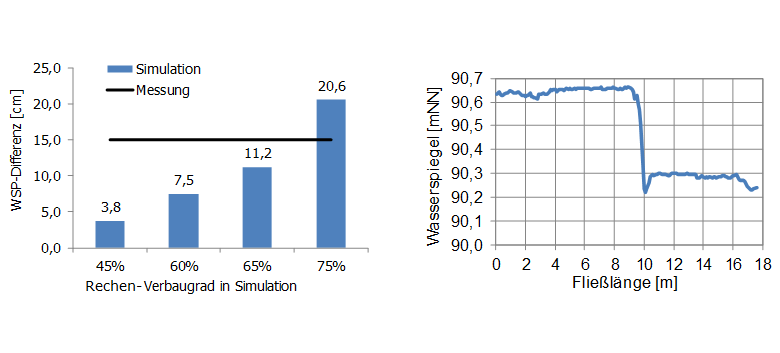
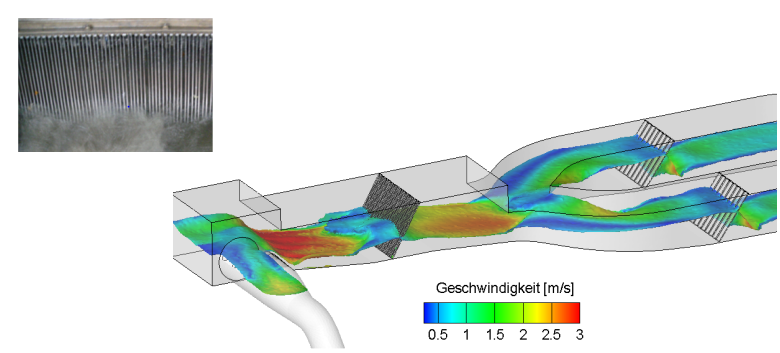
Figure: Test of different model-like opening widths of the bar screen to model hydraulic losses realistically.
.
Example 2: Determination and optimization of the distribution of waste water substances
- Status quo: unequal distribution of substances even though both bar screens receive the same hydraulic loading
- The distributary channel is higher loaded with substances
Recommendation with simulation:
- A separation baffle leads to a different distribution of the currents which improves the distribution of waste water substances
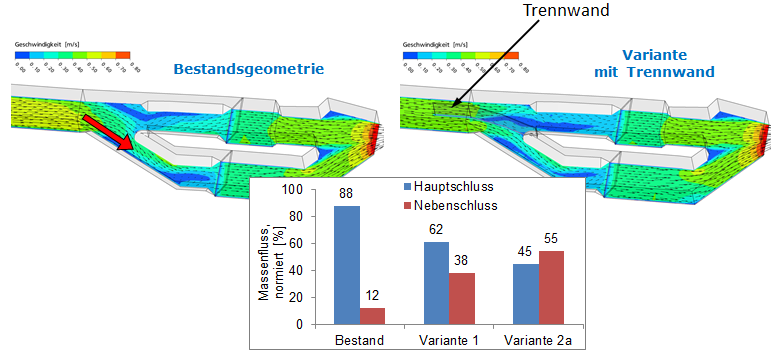
Figure: Optimization of bar screen inflow. Analysis of the distribution of organic particle with different settling velocities.
.
Example 3: Verification and optimization of depositions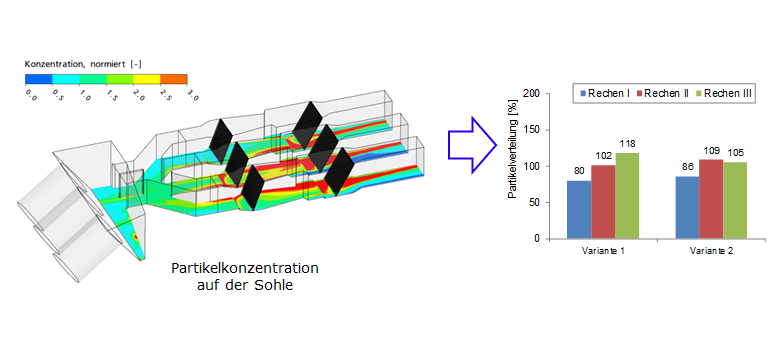
Figure: Verification of areas with depositions and analysis of the distribution of particles within a comparison of different variants.
.
Example 4: Simulation of a Center Flow Screen
- Model representation and optimization of the in- and outflow of a Center Flow Screen
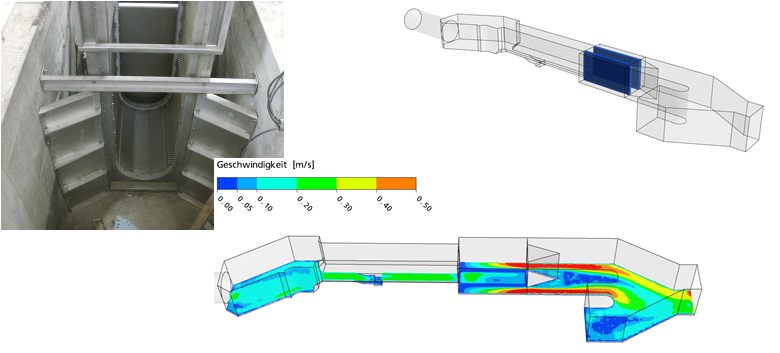
Figure: Modelling of a Center Flow Sreen. Illustraton of water velocities close to the bottom.