Simulation of Secondary Clarifiers
What are the benefits of hydrograv simulations?
- higher capacity: With an optimized inlet design above the limits of design guide lines, e. g. the German DWA-A 131
- maximum security against sludge overflow
- maximum effluent quality (SS, Ptot, COD) by optimized inlet design
- maximum use of the tank’s depth by optimized effluent design
- optimization of operational strategy, e. g. RAS, sludge displacement
- optimal function of the scraper system
- determination of the flocculation potential
What we offer:
- maximum predictability based on measurements of sludge concentrations on site in the settling tanks
- extensive data analyses to obtain representative loadings and for evaluation of the simualtion results
- extensive studies of design variants, operational strategies and optimizations
What are the features?
- two and threedimensional multiphase simualtios
- simulation of the sludge displacement between aeration und secondary clarifier
- realistic modelling of different scraper systems and sludge properties
Example 1: Measurement of the sludge concentration and validation of the simulation models
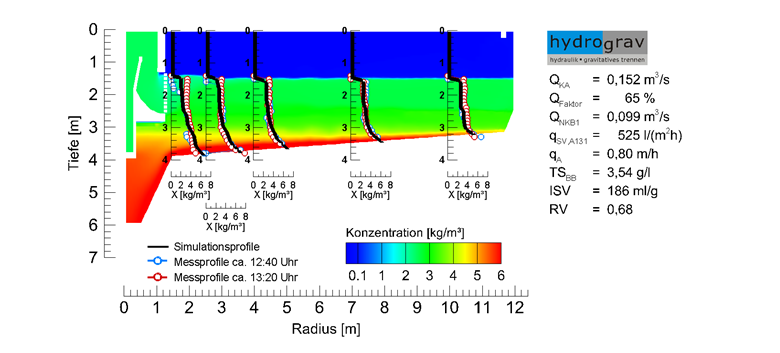
Figure: Distribution of the sludge concentratin in a circular tank.
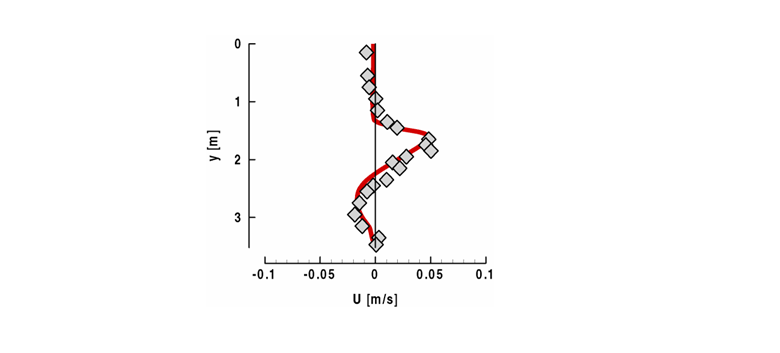
Figure: Comparison between measurement (points) and simulation (red line) of flow velocities from Armbruster (2004).
..
Example 2: Determination of representative loadings with proload.data
- extensive data analysis with hydrograv data analysis software proload.data, e. g. QWWTP, QRAS, SVI, MLSS, SS, Ptot, COD
- simulation verification for high, average und low loadings and optimization of a best possible inlet design for all loading cases
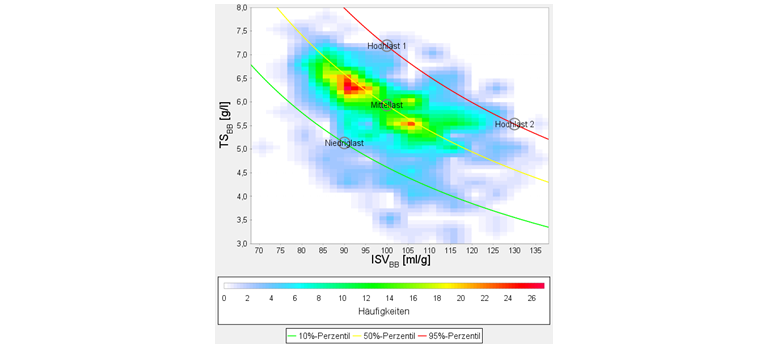
Figure: Two dimensional statistical analysis of the sludge volume considering the MLSS and the SVI.
Examle 3: Automatic optimization of the inlet design
- simulation with representative average sludge volumen for dry weather and stormwater flow
- determination of a best possible compromise of the inlet height and the opening height of a fixed inlet construction considering the individual operational strategy of the WWTP
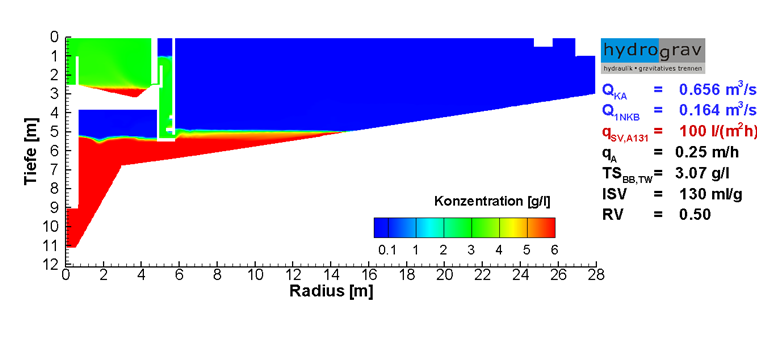
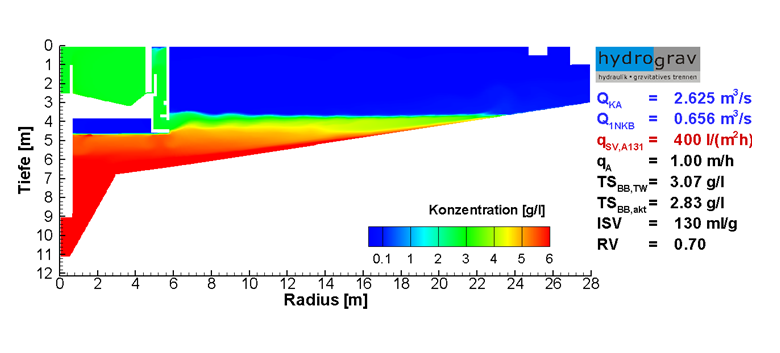
Figure: Sludge concentration and automatic adapted inlet geometry (inlet height and opening height) for representative average sludge volume for dry weather flow (above) and storm water flow (below).
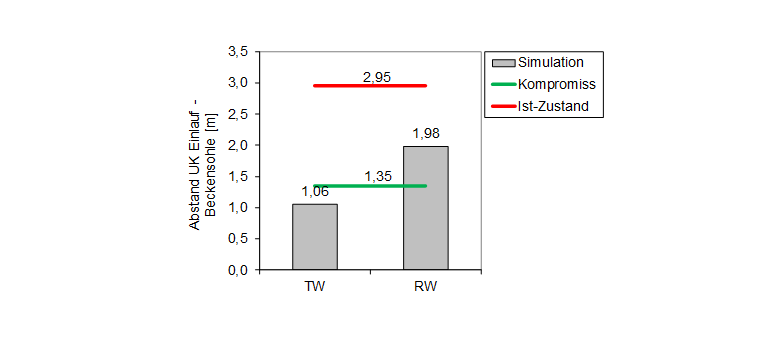
Figure: Determination of a best fitting fixed compromise inlet height.
Example 4: Determination of the maximum capacity
- e.g. capacity’s increase of 25 % by optimized inlet design
- e.g. loading exceeds 40 % the limits of the design guideline DWA-A 131 (see figure)
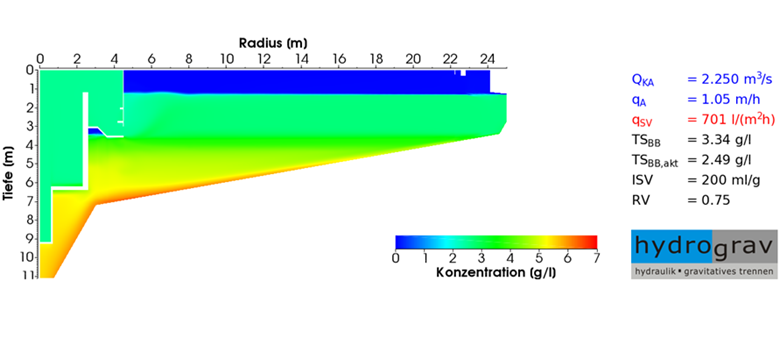
Figure: Sludge concentration in a secondary clarifier with height adaptive inlet system.
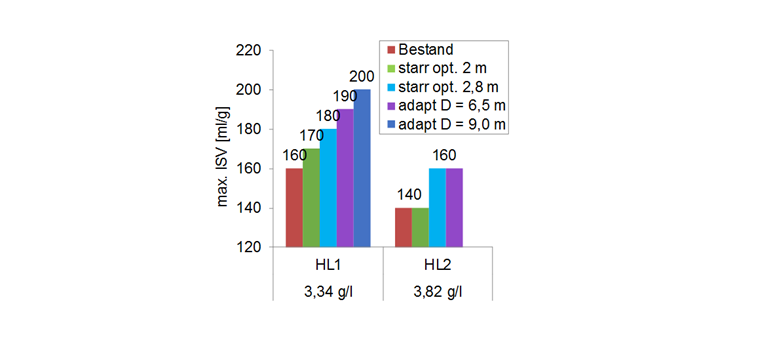
Figure: Determination of the maximum SVI for different inlet designs. Comparision between the status quo, a fixed optimization with two inlet heights und a height varialbe inlet design with two diameters.
.
Example 5: Improvements of the effluent quality
minimization of unstable sludge bed areas (ineffective Zone) = minimization of sludge flocs in the supernatant
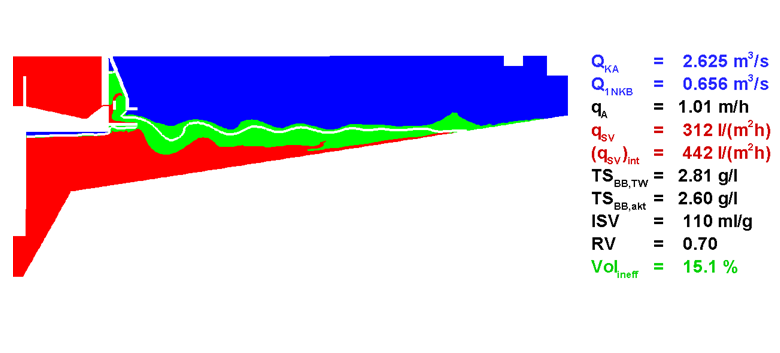
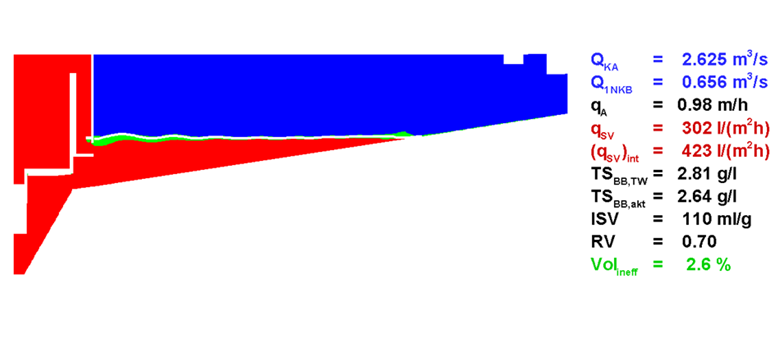
Figure: Categorisation of the sludge bed into functional zones. The green zone represents diluted unstable areas of the sludge bed. Above: Status quo. Below: Optimization.
.
Example 6: Optimization of geometric details – inlet design
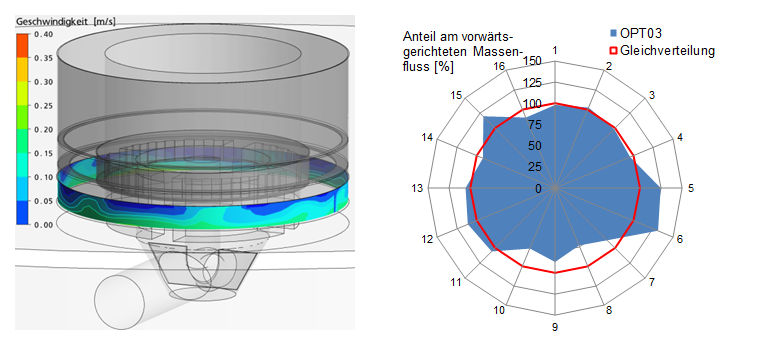
Figure: 3D-simulation of a inlet structure and analysis of the hydraulic distribution at the inlet opening.
.
Example 7: Verification of the flocculation potential 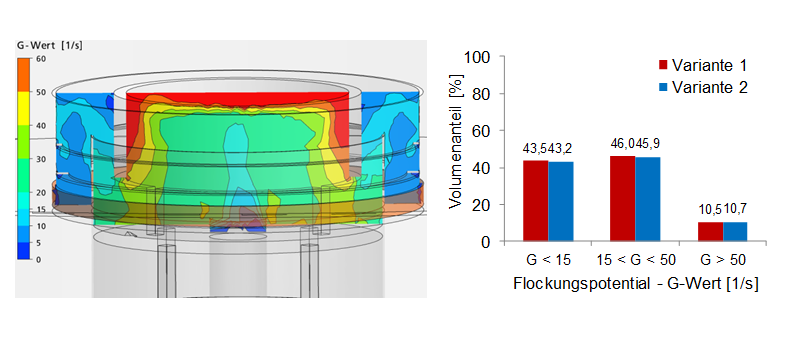
Figure: 3D-simulation of a inlet structure and analysis of the G-value.
.
Example 8: Optimization of a suction scraper
- in status quo unsufficient hydraulic capacity of the suction scraper system
- with optimization higher hydraulic capacity by optimization of different components
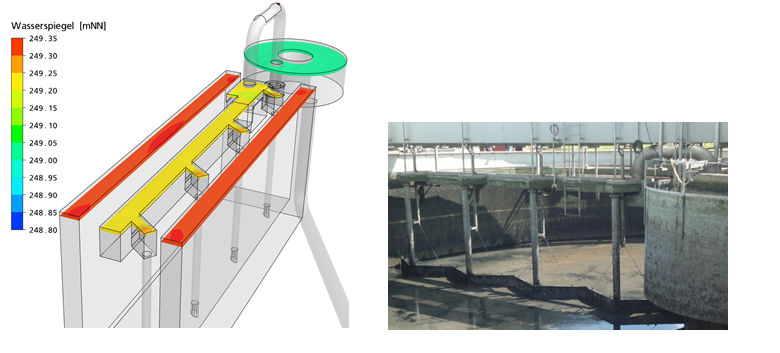
Figure: Detailed 3D-simulation of a suction scraper system and determination of hydraulic losses.
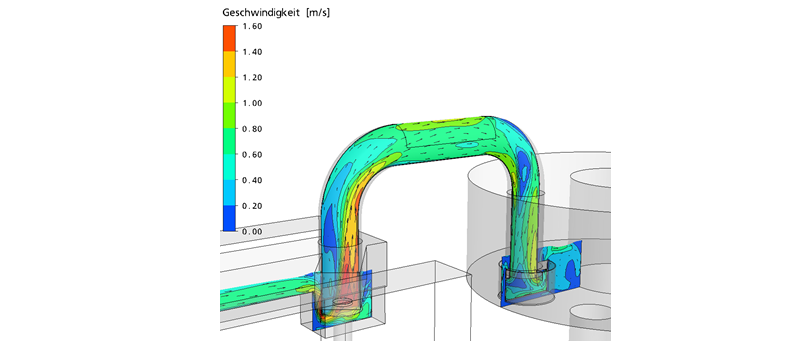
Figure: Detailled 3D-simulation of a lifting pipe.
.
Example 9: Verification of a rotation suction scraper system
- simulation of a rotating suction scraper system to study the impact of the sludge removal on the effluent quality
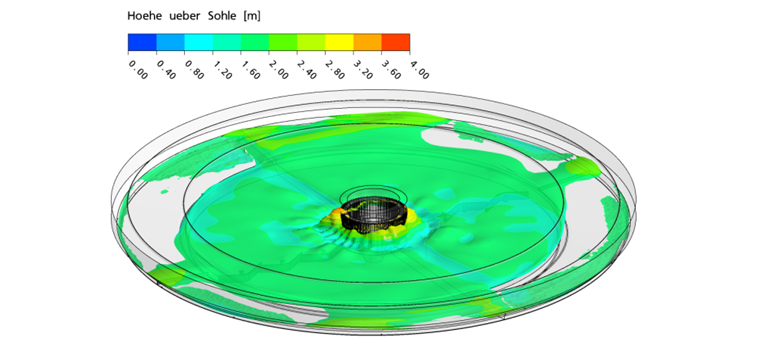
Figure: Detailled 3D-simulation of a rotating suction scraper system. Sludge level during dry weather loading.
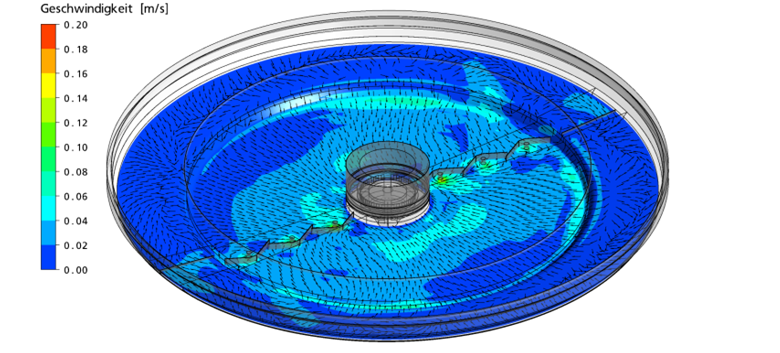
Figure: Detailled 3D-simulation of a rotating suction scraper system. Velocities close to the bottom during dry weather loading.