Simulation of entire Waste Water Treatment Plants
What are the benefits of hydrograv simulations?
- Virtual pre-launching of the entire WWTP already in the planning phase
- Analysis of hydraulic interactions between individual treatment steps
- Proof of various operating scenarios
Example: Support in the planning of the WWTP Emschermündung – one of the largest plants in Germany
(Qmax = 16,5 m³/s, 1.6 million PE)
- Simulation of serveral treatment steps as part of the planning for reconstruction and optimisation of the entire WWTP:
- Pumping station
- comparison of variants of different inflow designs to the screw pump station, investigation of different operating modes
- Bar screen
- functionial demonstration, especially the hydraulic distribution and deposition
- Grit chamber
- comparison of different variants, e.g. 6 or 8 lines in operation, optimization of the geometry and the operation mode, maximization of the separation rate
- Primary clarifier
- comparison of different variants, e.g. circular or rectangular design, test of grease separation
- Secondary clarifier
- extensive comparison of variants: test of different scraper systems, sludge hopper design, inlet design, number of required tanks, proofs of revision states and construction phase
- Distribution channels and structures
- Ensuring uniform hydraulic distribution, avoidance of depositions, e.g. by hydraulic correct installing agitators or aeration, uniform distribution of the distribution of MLSS, verification of hydraulic losses
- Pumping station
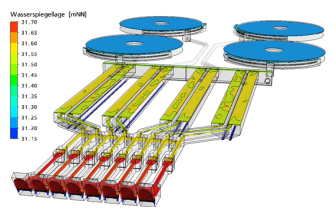
Figure: Entire model constisting of bar screen, grit chamber and primary clarification. Water level at maximum inflow.
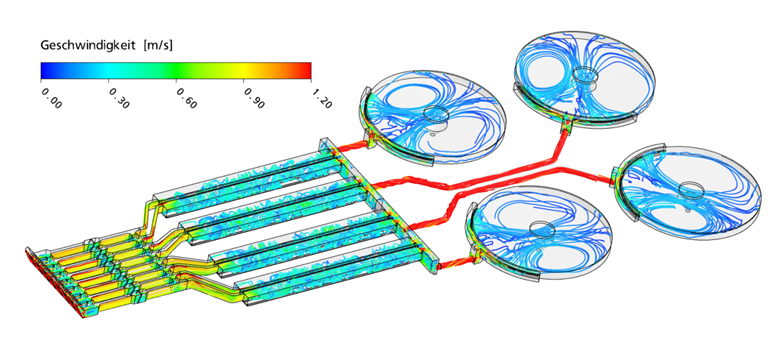
Figure: Entire model consisting of bar screen, grit chamber and primary clarification. Streamlines with velocities at maximum inflow
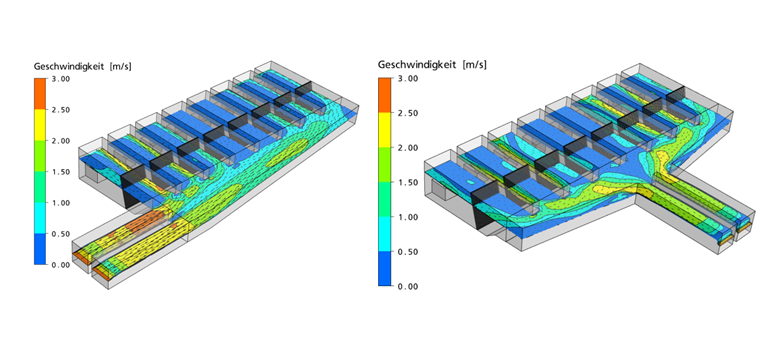
Figure: Pumping station incl. bar screens. Exemplary comparison of variants. Flow velocities along the water level at stormwater inflow. Six out of eight pumps in operation.
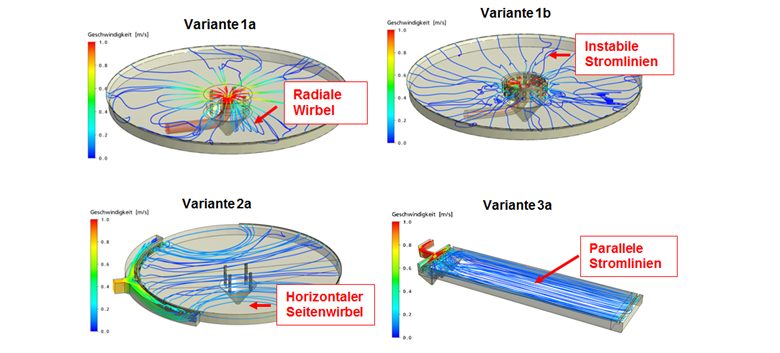
Figure: Primary clarification. Exemplary comparison of variants. Streamlines with velocities.
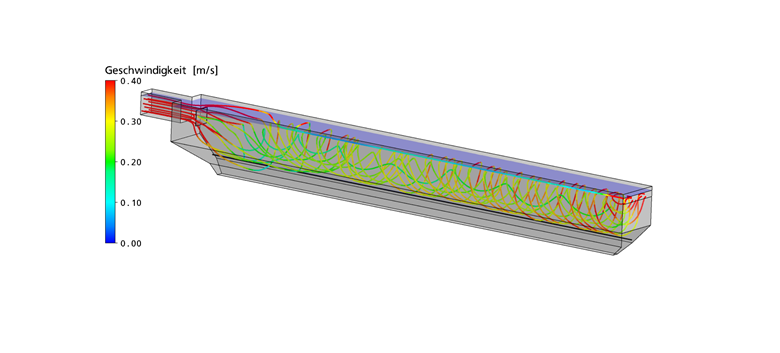
Figure: Grit chamber. Exemplary illustration of a variant. Streamlines with velocities.
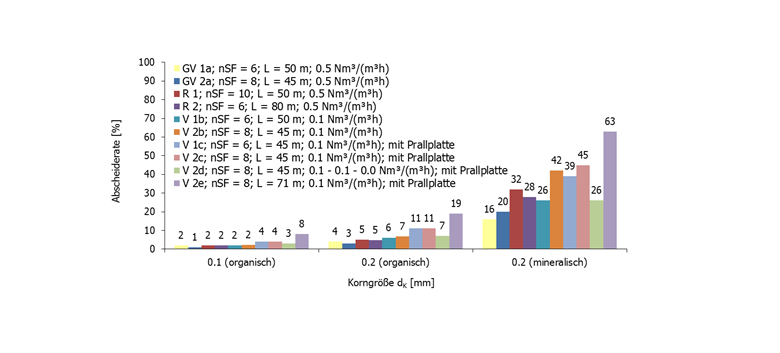
Figure: Grit chamber. Separation rate of different classes of materials for different variants.
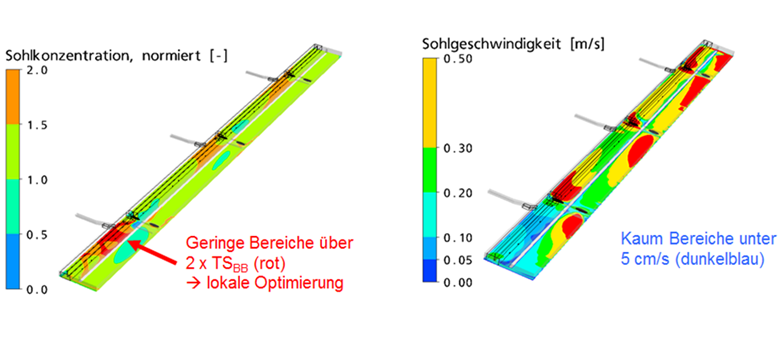
Figure: Inlet channel to activated sludge tank, exemplary analysis of a variant. Concentrations close to the bottom normalized with the mean basin concentration (left). Flow velocities close to the bottom (right). Note: For better legibility the basin width is shown stretched 4 times.
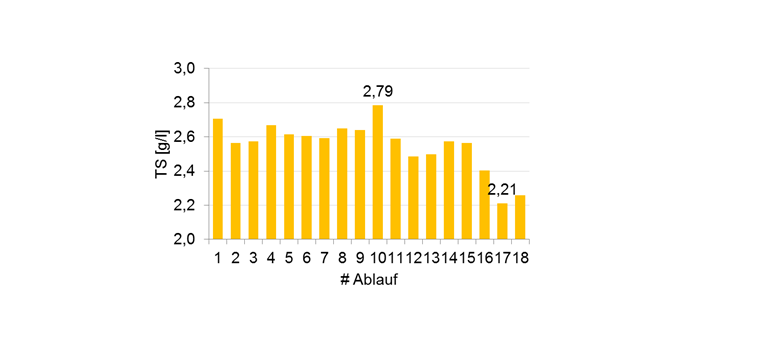
Figure: Inlet channel to the aeration tanks, exemplary distribution of the inflow concentration.
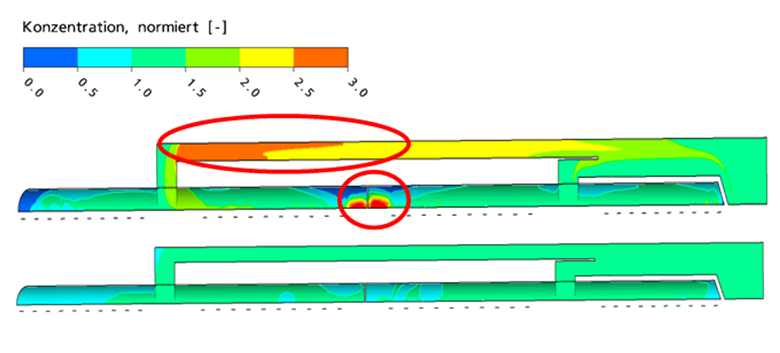
Figure: Inflow channel secondary clarification, exemplary evaluation of an investigated variant. Standardized sludge concentration 5 cm above the basin bottom. Above dry weather, below rainy weather.
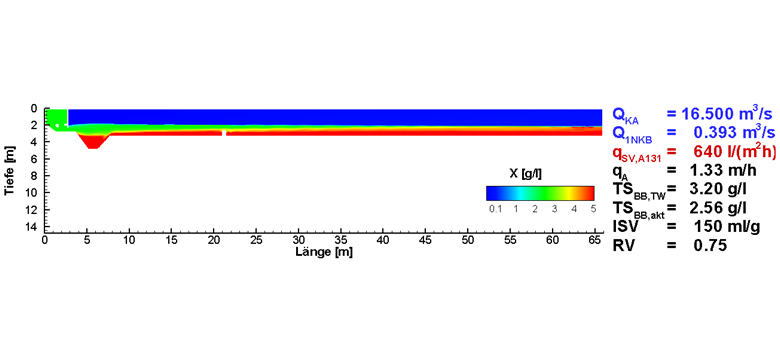
Figure: Secondary clarification, exemplary analysis of a variant showing the sludge concentration at maximum inflow.
.